Event Horizon Telescope
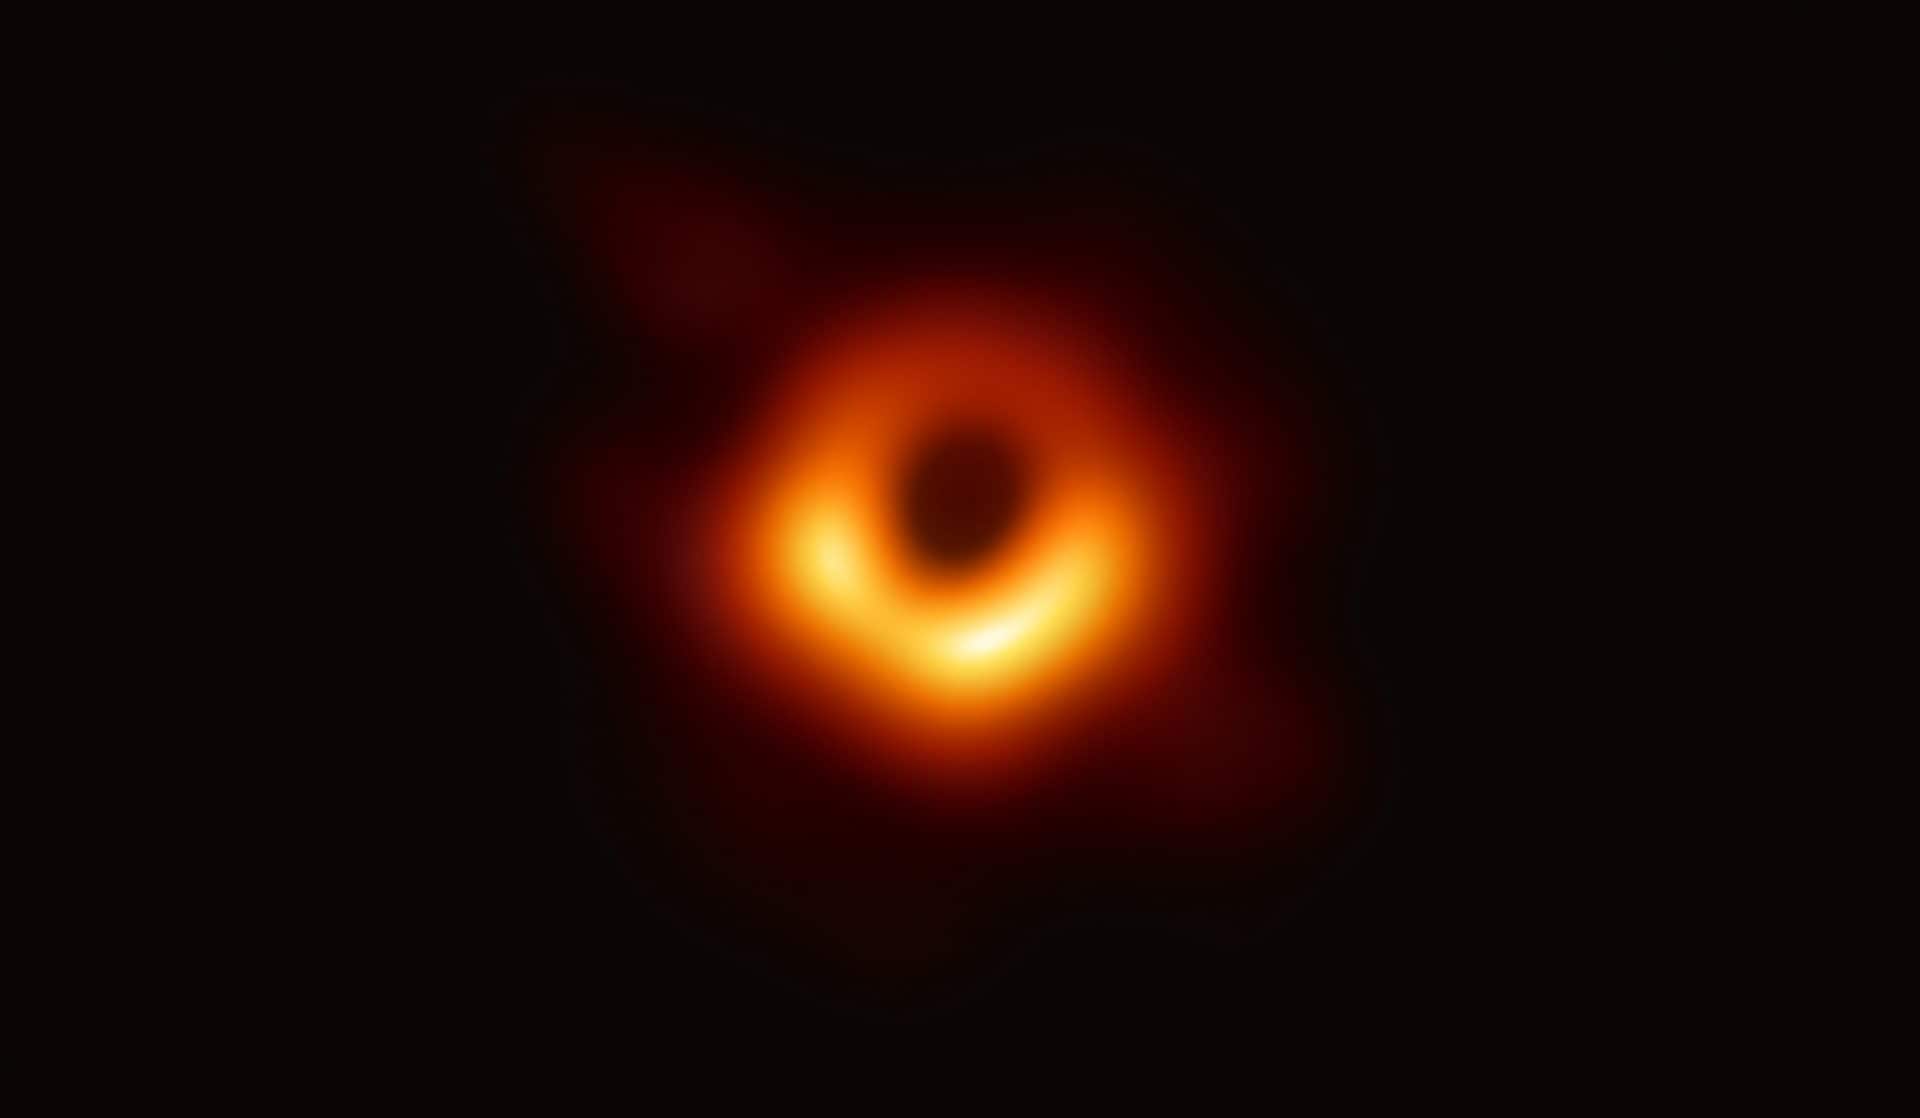
On April 10th 2019, the Event Horizon Telescope (EHT) project team released the first picture ever taken of a black hole. The subject is a supermassive black hole residing in the Messier 87 galaxy, 53 million light-years away. This black hole has a mass of 6.5 billion Suns, with such a gravitational pull that even light cannot escape beyond its event horizon. So, as the black hole itself is dark, there is nothing to photograph. In the Event Horizon Telescope’s image, it appears as a dark orb.
So how is it possible to photograph? Well, first you need a telescope, (spoiler alert: one single telescope won’t cut it). So, instead, we take many telescopes and using a technique called Very Long Baseline Interferometry (VLBI), we can create something of a virtual telescope. VLBI works something like this: several antennas around the globe collect a signal, and the distances between these antennas are calculated, based on the arrival time of the signal. Atomic clocks situated at each location measure the arrival time. This makes it possible to combine the data from the different antennas and, in practice, have an antenna the size of the span between them. During observations, EHT had 8 sites creating a virtual telescope with a diameter almost the size of the planet and giving an angular resolution of 20 micro-arcseconds. Yeah, I know, “cool number bro, what does it mean?” That’s the resolution you would need to be able to read a newspaper in Paris from New York.
During the five days that the EHT was active, all the telescopes together collected about a petabyte of data. The amount of data was too much to transfer by wire, so the team took the hard drives containing the data and flew them to the MIT Haystack Observatory and the Max-Planck-Institute for correlation. There the data was stripped of any time delays caused by the different positions of the telescopes, as well as stripping any possible background noise and interference.

There were several steps from the raw VLBI voltage data to the final data-product, where the actual image analysis begins. The first step is the correlation, where the data is aligned to a common time reference by applying an earth geometry and delay model (they threw math at that little problem). After this process, there are still huge (huuuuge) amounts of data left to process, so the next step is to consider the variations and “shifts” that happen during data collection. Examples: the positions of the telescopes may differ from estimates, electronic delays, and variations in atmospheric humidity. These variations from the theoretical (and many other deviations), need small corrections to the model values in a process called Fringe fitting. After this process, the data has been averaged to a manageable size and is post-processed to enable further analysis.
This has been a very short run-through of the collection and processing of the data behind the EHT photograph (and we haven’t even talked about the photo itself). Hopefully, we can revisit this subject and talk about the algorithms that generated this amazing image.
If you are interested, you can find more information here.
Contact us